The Comas Group is faced with the task of modernizing its reporting and analysis processes. Heterogeneous data sources and manual Excel evaluations make it difficult to obtain a consistent and reliable overall picture of financial, project and sales figures. With international growth, complexity is also increasing — various ERP systems, historical databases and new technical requirements require a reliable solution.
In order to enable transparency, scalability and efficient analyses, the Comas Group opts to build a central data platform based on Microsoft Fabric. Today, it forms the basis for modern, flexible reporting in Power BI and the development towards a data-driven organization.
What technological basis is needed to reliably integrate different data sources and support future growth?
How can efficiency in reporting and controlling be increased while enabling self-service analytics for specialist areas?
What business value do structured data processes and modern data architectures such as Data Vault create?
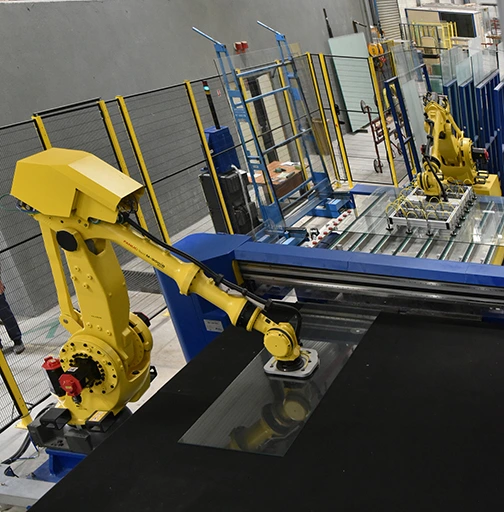
The various ERP, project and sales data as well as historical Excel inventories are connected and converted into a uniform structure via Microsoft Fabric.
The data is purified, harmonized and modeled in a data vault approach in a layered model. This creates a consistent, scalable basis for all further analyses.
Based on the data models, Power BI creates interactive reports for finance, sales and project controlling. Users get self-service options and clear, intuitive visualizations.
The data platform is constantly being expanded: new systems, international locations and additional use cases are being integrated. Clear governance and iterative development create a sustainable reporting ecosystem.
The result is a modern reporting landscape that, for the first time, bundles all relevant financial, project and sales data in a central Power BI interface. The new data platform in Microsoft Fabric creates transparent, consistent analyses across all locations and enables well-founded decisions in real time. As a result, Comas increases data quality, increases efficiency in controlling and lays the basis for further use cases such as AI-based analyses, forecasting and international scaling.
The Comas Group wanted to modernize its reporting and analysis processes and create a central, scalable database. The aim was to consistently evaluate financial, project and sales data, enable self-service analytics and make reporting internationally sustainable.
Prior to the project, heterogeneous data sources, historical data sets and manual Excel evaluations made it difficult to obtain a reliable overall picture of financial, project and sales figures. With international growth, complexity increased even more because different ERP systems, new technical requirements and different locations had to be taken into account.
taod developed a central data platform based on Microsoft Fabric and several Power BI dashboards for the Comas Group. For this purpose, ERP, project, sales and historical Excel data were transferred into a uniform structure so that reporting and analyses can be based on a common basis.
The introduction was gradual: First, the relevant data sources were integrated and structured in Microsoft Fabric. Based on this, interactive Power BI reports were created for finance, sales and project controlling, while the platform was designed in parallel so that further systems, international locations and additional use cases can be continuously integrated.
The Comas Group now has a modern reporting landscape that bundles all relevant financial, project and sales data in a central Power BI interface. The data platform in Microsoft Fabric creates transparent and consistent analyses across locations, increases efficiency in controlling and lays the basis for further use cases such as AI-based analyses, forecasting and international scaling.
Let us answer your questions during a non-binding initial consultation.

We'll help you choose a data platform and build an infrastructure that's right for your business.
Three leading data platforms: Databricks, Microsoft Fabric and Snowflake in a quick check

Learn how to stay in control of your costs with Databricks, Snowflake, and Fabric.